
PHPL Profitable Trading Strategy AFL
Just copy this PHPL Profitable Trading Strategy AFL Code in your Amibroker formula editor, then save and apply for running it in you system
_SECTION_BEGIN("Trading Strategy For Intraday And Swing Traders");
SetBarsRequired(sbrAll,sbrAll);
SetFormulaName( "Trading Strategy For Intraday And Swing Traders" );
SetOption( "Initialequity", 150000 );
SetOption( "AccountMargin", 0.20 );
SetOption( "MinShares", 75 );
SetOption("AllowSameBarExit", True );
MaxOpenPos = Param( "MaxOpenPos", 1, 1, 200, 1 );
SetOption( "MaxOpenPositions", MaxOpenPos );
SetOption( "PriceBoundChecking", True );
SetTradeDelays(0, 0, 0, 0);
SetOption( "UsePrevBarEquityForPosSizing", 1 );
SetOption( "CommissionMode", 2 );
SetOption( "CommissionAmount", 20 );
SetOption( "ActivateStopsImmediately",0 );
PositionSize = 750000;
DC = TimeFrameCompress( C,inDaily,compressLast );
DH = TimeFrameCompress( H,inDaily,compressHigh );
DL = TimeFrameCompress( L,inDaily,compressLow );
DLO = TimeFrameCompress( O,inDaily,compressOpen );
DC1 = TimeFrameExpand( DC,inDaily,compressLast );
DL1 = TimeFrameExpand( DL,inDaily,compressLast );
DH1 = TimeFrameExpand( DH,inDaily,compressLast );
DLO1 = TimeFrameExpand( DLO,inDaily,compressOpen );
GraphXSpace=10;
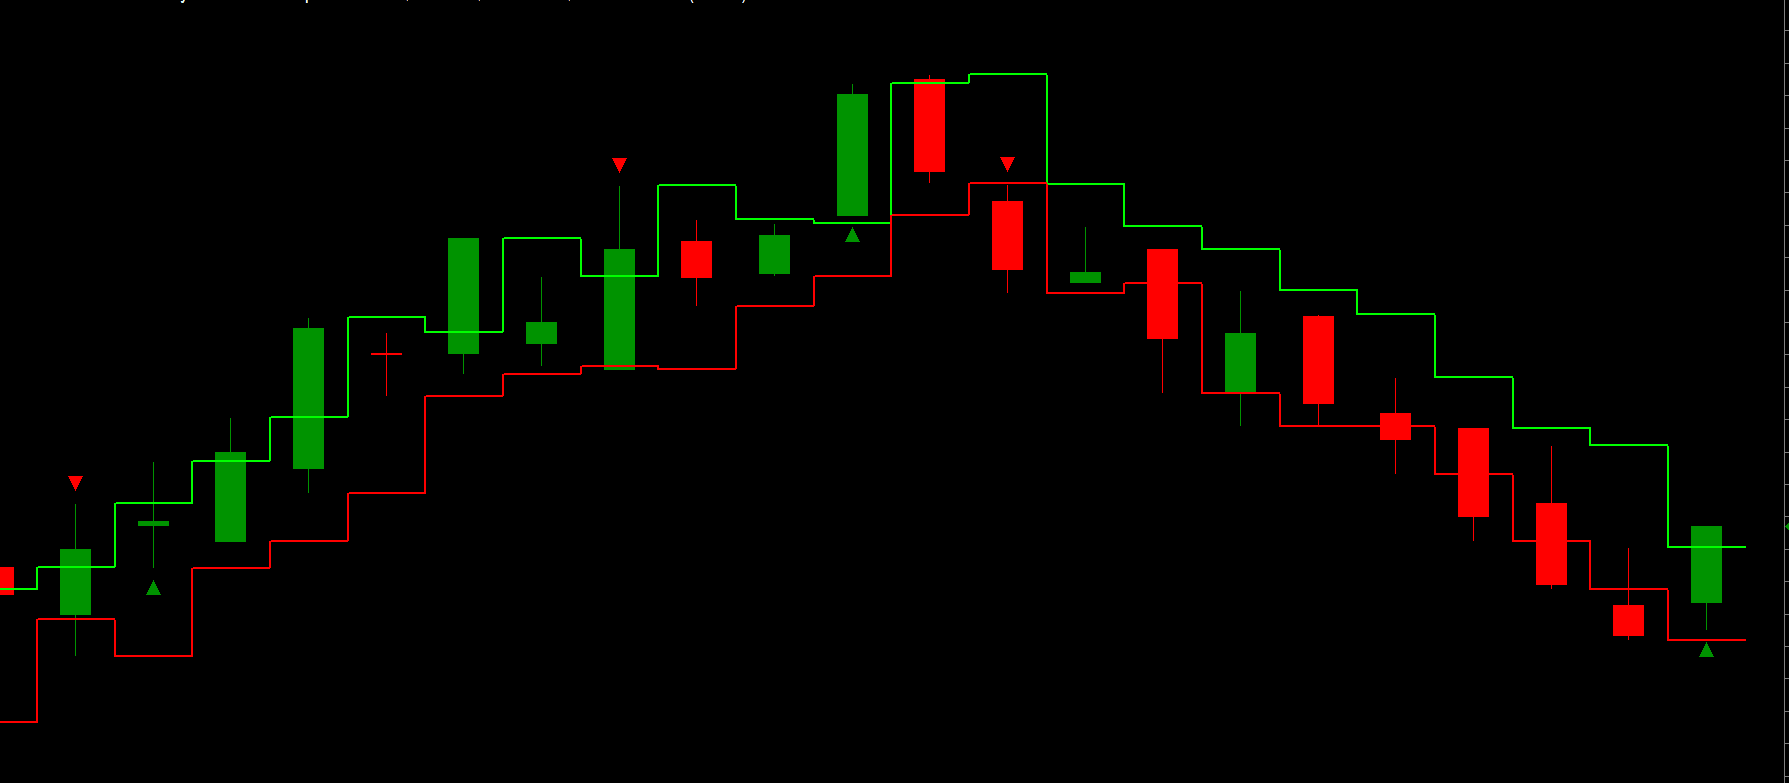
Plot(Ref(DL1,-1),"PLow",colorRed,styleStaircase|styleThick|styleNoLabel|styleNoTitle);
Plot(Ref(DH1,-1),"PHigh",colorBrightGreen,styleStaircase|styleThick|styleNoLabel|styleNoTitle);
SetChartOptions(0,chartShowArrows|chartShowDates);
_N(Title =StrFormat("{{NAME}} - {{INTERVAL}} {{DATE}} Open %g, Hi %g, Lo %g, Close %g (%.1f%%) {{VALUES}}", O, H, L, C,
SelectedValue( ROC( C, 1 ) ) ));
PlotOHLC(O,H,L,C,"Close",IIf(C>O,colorGreen,colorRed),styleCandle|styleThick|styleNoTitle );
Buy = H >= Ref(DH1,-1);
Sell = L <= Ref(DL1,-1);
Cover = Buy;
Short = Sell;
Buy = ExRem(Buy,Sell);
Short = ExRem(Short,Cover);
Cover = ExRem(Cover,Short);
Sell = ExRem(Sell,Buy);
PlotShapes(shapeUpArrow*Buy, colorGreen, 0, L, -20 ); PlotShapes(shapeDownArrow*Sell, colorRed, 0, H , -20 );
BuyPrice = ValueWhen(Buy,IIf(DLO1>Ref(DH1,-1),DLO1,Ref(DH1,-1)),1);
ShortPrice = ValueWhen(Short,IIf(DLO1<Ref(DL1,-1),DLO1,Ref(DL1,-1)),1);
CoverPrice = BuyPrice;
SellPrice = ShortPrice;
Open_Long = Flip( Buy, Sell );
Open_Short = Flip( Sell, Buy );
Buy_Price = ValueWhen( Buy, BuyPrice, 1 );
Short_Price = ValueWhen( Short, ShortPrice, 1 );
Sell_Price = IIf( Sell, ValueWhen( Sell, SellPrice, 1 ), Short_Price );
Cover_Price = IIf( Cover, ValueWhen( Cover, CoverPrice, 1 ), Buy_Price );
Profit = IIf( Open_Long, ( Close - Buy_Price ), IIf( Open_Short, ( Short_Price - Close ), 0 ) );
Last_Profit = IIf( Ref( Open_Long, -1 ) == 1 AND Open_Long != 1, ( Sell_Price - Buy_Price ), IIf( Ref( Open_Short, -1 ) == 1 AND Open_Short != 1, ( Short_Price - Cover_Price ), 0 ) );
Cum_Profit[0] = Last_Profit[0];
PreviousProfit = ValueWhen(Last_Profit!=0,Last_Profit,1);
for ( i = 1;i < BarCount;i++ )
{
Cum_Profit[i] = Cum_Profit[i-1] + Last_Profit[i];
}
Trade[0] = 0;
for ( i = 1;i < BarCount;i++ )
{
if ( Buy[i] == 1 OR Short[i] == 1 )
{
Trade[i] = Trade[i-1] + 1;
}
else
{
Trade[i] = Trade[i-1];
}
}
// RESULT TABLE //
RT = ParamToggle( "RT", "Show|Hide", 1 );
if ( RT == 1 )
{
GfxSelectFont( "Verdana", 13, 100 );
GfxSetBkMode( 1 );
GfxSetTextColor( colorBlack );
GfxSelectSolidBrush( colorLavender );
pxHeight = Status( "pxchartheight" );
xx = Status( "pxchartwidth" );
Left = 1100;
width = 310;
x = 5;
x2 = 350;
y = pxHeight;
GfxSelectPen( colorRed, 1 ); GfxRectangle( x, y - 105, x2, y ) ; GfxTextOut( ( "Total Trades : " + WriteVal( Trade, 3.0 ) ), 13, y - 105 ); GfxTextOut( ( "Total Profit : " + WriteVal( Cum_Profit, 4.2 ) ), 13, y - 85 ); GfxTextOut( ( "Previous Profit : " + WriteVal( PreviousProfit, 2.2 ) ), 13, y - 45 ); GfxTextOut( ( "Price : " + WriteVal( Close, 2.2 ) ), 13, y - 65 ); GfxTextOut( ( "Current Profit : " + WriteVal( Profit, 2.2 ) ), 13, y - 25 );
}
// TRADES ON CHART //
for ( i = 0; i < BarCount; i++ )
{
if ( Buy[i] )
PlotText( "Buy\n" + BuyPrice[ i ], i, DL1[i-1], colorGreen, colorDefault ,-30 );
if ( Short[i] ) PlotText( "Short\n" + ShortPrice[ i ], i, DH1[i-1], colorRed, colorDefault ,30 );
}
_SECTION_END();


Your PlotShapes(shapeUpArrowBuy, colorGreen, 0, L, -20 ); PlotShapes(shapeDownArrowSell, colorRed, 0, H , -20 ); at line 40 of PHPL Profitable Trading Strategy is not working
Oh! It was omitted by the site in copy-paste. I updated it and checked working well now. Thanks for the feedback.