_SECTION_BEGIN("Custom ADX Indicator");
P = Param("Period",14,5,50,1);
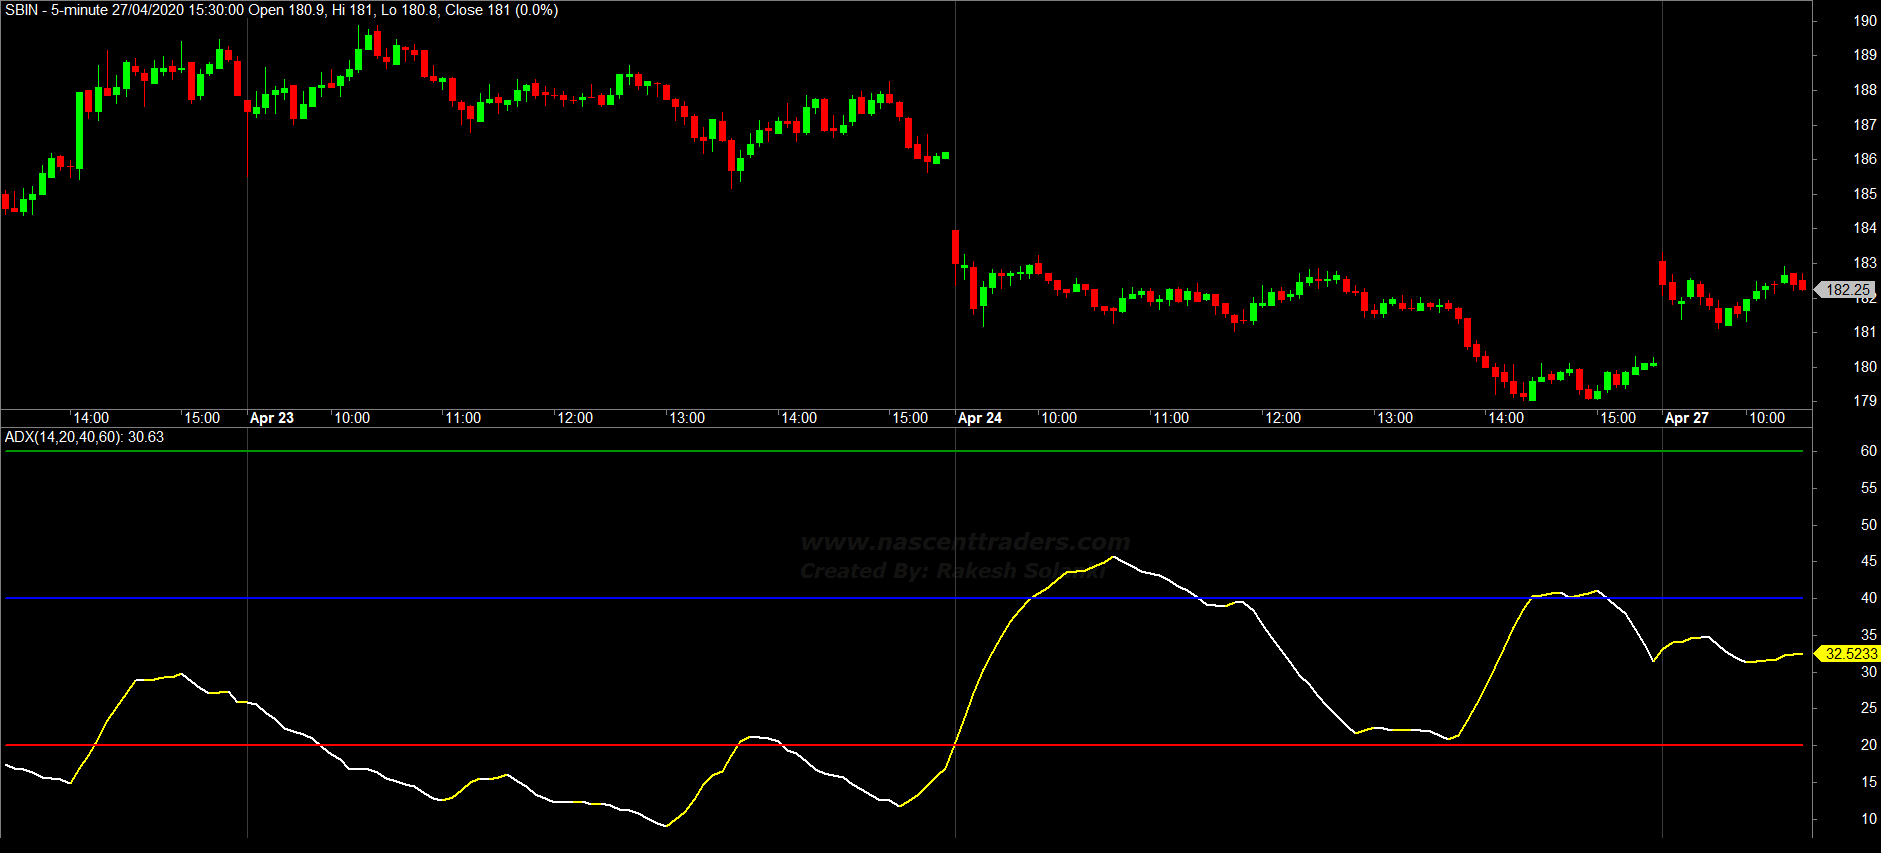
L1 = Param("Sideway Level",20,5,30,1);
L2 = Param("Trend Level",40,10,50,1);
L3 = Param("Strong Trend Level",60,20,80,1);
A = ADX(P);
Color = IIf(A>Ref(A,-1),colorYellow,colorWhite);
Plot(L1,"Sideway Level",colorRed,styleLine|styleThick|styleNoTitle|styleNoLabel);
Plot(L2,"Trend Level",colorBlue,styleLine|styleThick|styleNoTitle|styleNoLabel);
Plot(L3,"Strong Trend Level",colorGreen,styleLine|styleThick|styleNoTitle|styleNoLabel);
Plot(A,"ADX",Color,styleLine|styleThick);
GfxSetOverlayMode(1);
GfxSelectFont("Verdana",12,800,True );
GfxSetBkMode(0);
GfxSetTextColor(ColorRGB(18,18,18));
GfxTextOut("Created By: Rakesh Solanki",800,130 );
GfxSelectFont("Verdana", 14, 800, True );
GfxSetBkMode(1);
GfxTextOut("www.nascenttraders.com",800,100 );
Title = "ADX"+_PARAM_VALUES()+": "+NumToStr(A, 1.2);
_SECTION_END();